Follow @solverworld Tweet this
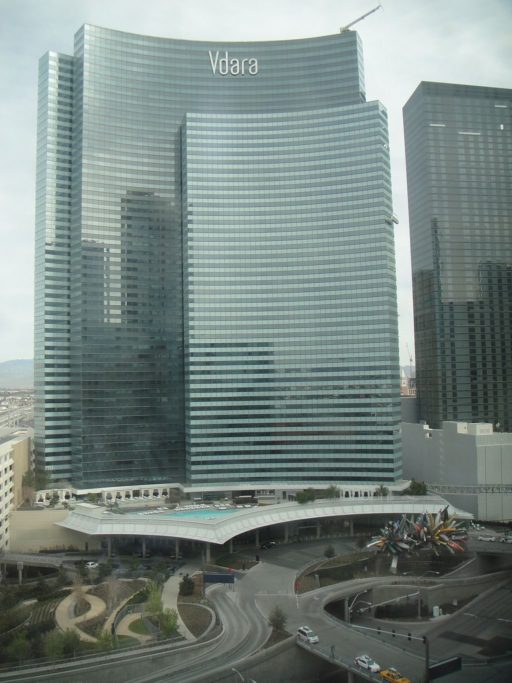
The Vdara hotel in Las Vegas gained some notoriety in 2010 when guests complained about getting severe burns from the pool deck area (see article). Note the curved facade and the pool and deck immediately below. Image By Cygnusloop99 (Own work) [CC BY-SA 3.0 or GFDL], via Wikimedia Commons
Here is the view from Google maps. We will use this to get some measurements for the hotel:
We are going to build a simple simulation of the solar radiation reflection off the hotel mirrored facade. To this, we will need some things:
- The geometry of the hotel and pool deck area
- The orientation of the sun by time and date
- Calculations for reflection of the sun’s rays and their intersection with the pool deck.
Let’s take them in order.
Hotel Geometry
From a hotel floor plan, easily obtained on the web, we trace out the pool, pool deck, and facade surfaces. Using the above satellite photo to get the scale properly, we then create 2 circular surfaces that closely match the facade geometry. The radii of the 2 facades are 91.2m and 112.2m. This is what the mathematical curves overlaid on the image look like. The axes are in meters and North is facing upward. Notice that the curved surfaces have a very nice southern exposure.
In this image, I have extended the second wall (orange) all the way in order to see how it fits on the floor plan. It is slightly above the floor plan at its right-most edge because there is a slight separation between the 3 semi-circular facades.
You can see the original floor plan here (rotated) Vdara Floor Plan.
Sun Orientation
The Wikipedia Sun Position article has a good introduction to the basic calculations. We will review what we need here. Basically, there are two coordinate systems that we will need. The first is the ecliptic coordinate system, in which the sun and stars are (roughly speaking) constant. Think of it as the stars’ coordinate system. In it, the ecliptic latitude is the angle from the plane of the Earth’s orbit around the Sun. The ecliptic longitude of the Sun is zero when the Earth is at the vernal equinox. So the ecliptic latitude of the Sun is 0, and the longitude depends on the day of the year, at least to the precision that we need for our solar convergence calculations.
The other coordinate system that we will need is the horizontal coordinate system. This coordinate system is referenced to a viewer on a spot on the Earth, and has
- Solar altitude: the angle above the horizon. Its complementary angle is the Solar zenith.
- Solar azimuth: the angle from the North, increasing clockwise towards the East. Thus, 90 degrees is East and 180 degrees is South.
Rather than give all the equations for the calculations, which you can find on the Wikipedia page, I will give a Python function that will calculate the Sun’s position. The hour is the time before/after Solar Noon, which is when the Sun is at it’s highest point in the sky (close to Noon local time), and simpler to use here than trying to calculate from local time (which requires knowledge of time zones, etc.). Since we will be computing the Sun’s angle as it moves through the sky, the exact time is not important to us. If you want to check out when solar noon occurs, and compare the function below for accuracy, see NOAA Solar Calculations. For Las Vegas, the NOAA site matched this function within a few tenth’s of a degree.
def sun(hour, dt_noon=None):
  #compute sun at hour before/after solar noon on dt_noon, e.g. hour=-1 is 1 hour before solar noon
  if dt_noon is None:
    dt_noon=datetime.datetime(2017,8,24,hour=12,minute=0,second=0)
  #ecliptic coordinates
  n=(dt_noon - datetime.datetime(2000,1,1,hour=12)).days  #number of days since 1/1/2000
  L=(280.46+.9856474*n)/180*math.pi
  g=(357.528+.9856*n)/180*math.pi
  L=angle(L)  # make sure in 0-2*pi range
  g=angle(g)
  ecliptic_longitude=L+(1.915*math.sin(g)+0.020*math.sin(2*g))/180*math.pi
  ecliptic_latitude=0.0
  obliquity_of_ecliptic=23.4/180*math.pi

  hour_angle=(hour*15)/180*math.pi
  sun_declination=math.asin(math.sin(obliquity_of_ecliptic) * math.sin(ecliptic_longitude))

  solar_altitude=math.asin(math.sin(local_latitude)*math.sin(sun_declination)+
  math.cos(local_latitude)*math.cos(sun_declination)*math.cos(hour_angle))
  solar_zenith=math.pi/2-solar_altitude
  #solar_azimuth=math.pi-math.asin(-math.sin(hour_angle)*math.cos(sun_declination)/math.sin(solar_zenith))
  #solar_azimuth is measured by 0=north, 90 degrees=East, 180=South.
  #Note: problem when asin argument is around 1, because there are 2 solutions (like 85 and 95), so
  #we might get the wrong answer around sunrise/sunset.
  #This alternate version does not have the same problem, but we have to be careful about sign of h
  n1=math.sin(sun_declination)*math.cos(local_latitude) -
  math.cos(hour_angle)*math.cos(sun_declination)*math.sin(local_latitude)
  d1=math.sin(solar_zenith)
  if (n1/d1) >= 1.0:
    solar_azimuth=0
  elif (n1/d1<-1.0):
    solar_azimuth=math.pi
  elif h<0:
    solar_azimuth=math.acos(n1/d1)
  else:
    solar_azimuth=2*math.pi-math.acos(n1/d1)
  return solar_altitude, solar_azimuth
Reflections and Intersections
The last piece we need are the calculations for reflections off surfaces. If a light ray vector L impinges on a surface with unit normal N, it will be reflected with the same angle opposite the normal. Looking at this figure:
We can see that
\begin{align}
P=-(N \cdot L)N
\end{align}
because it is the projection of L onto the normal N. Then we have
\begin{align}
R-L&=2P \\
R&=L-2(N \cdot L)N
\end{align}
Now that we have the reflected ray, we need to see how it intersects with the ground (or pool deck). For a plane described by a point \(p_0\) and normal \(n\) containing all points p such that:
\begin{align}
(p-p_0) \cdot n = 0
\end{align}
and a line described by a point \(l_0\) and a vector in the direction of the line \(l\) where the line is
\begin{align}
p=dl+l_0
\end{align}
points p for all real numbers l. If we solve these 2 equations for d, we get:
\begin{align}
d=\frac{(p_0-l_0) \cdot n}{l \cdot n}
\end{align}
which we can substitute back into the previous equation to get the intersection point \(p\).
Putting It All Together
Using Python and matplotlib, we can easily piece together a simulation of the intensity of the Sun’s rays. To start, I tested the program with a simple flat facade in roughly the orientation of the first Vdara curved wall.
The red line, at approximately -18 degrees, is the mirrors position on the floor plan. The wall is 176m high, which is the height of the Vdara hotel.
The solar intensity is about 1.0 for the entire parallelogram image, which sort of what we would expect for a flat mirror. It is not exactly 1 because the sun is not hitting the pool deck at exactly 90 degrees. The 3 yellow lines represent the Sun’s azimuth. Because this is solar 12:00 (solar noon), the azimuth is exactly 180 degrees.
Now, let us look at the results for the curved facade.
Wow. You can things are starting to heat up. Believe it or not, the peak solar value is 15 in this plot. A few things to be careful about:
- I have not modeled the different heights of the 3 curved walls, nor the third wall that extends a little bit beyond the second wall
- I have not modeled rays that have 2 or more reflections from their first intersection with the wall. That is, some rays can hit the wall at an oblique enough angle to then hit the wall again. In the figures to come, you can see that because some rays accumulate behind the wall, which would not happen in reality.
- I have assumed that the walls are 100% reflective with no loss. The architect did place some kind of plastic covering to reduce the reflection; how much has not been reported. Also, with glass windows, some of the light passes through the window; how much is transmitted vs. reflected depend on the angle of incidence and the index of refraction of the glass. A more accurate model would take this into account.
Now, placing several of these figures in an animation around solar noon, we can see how the hot spots move across the pool deck:


